Accessibility
The new charts include a text-based data view so the values are not available only as an image.
- Chart view
- Visual or table
Use the paired buttons to inspect the same values in either layout.
- Keyboard
- Native controls
Search, filters and expandable questions use standard controls.
- Small screen
- Responsive layout
Charts and reading columns adapt to the viewport.
Readable comparisons
The site uses semantic headings, text links, responsive reading columns, visible keyboard focus, a skip link, and native controls for expandable information, chart displays and review filters. Browser settings can enlarge text or apply other reading preferences.
These are implementation choices, not a claim of formal accessibility certification. Outside provider sites have separate practices. If their assessment or payment flow presents a barrier, contact the provider for an alternate route.
Simple starting points
The review directory and guide directory offer text descriptions of the available information. Prices and offer details are not conveyed only in a picture.
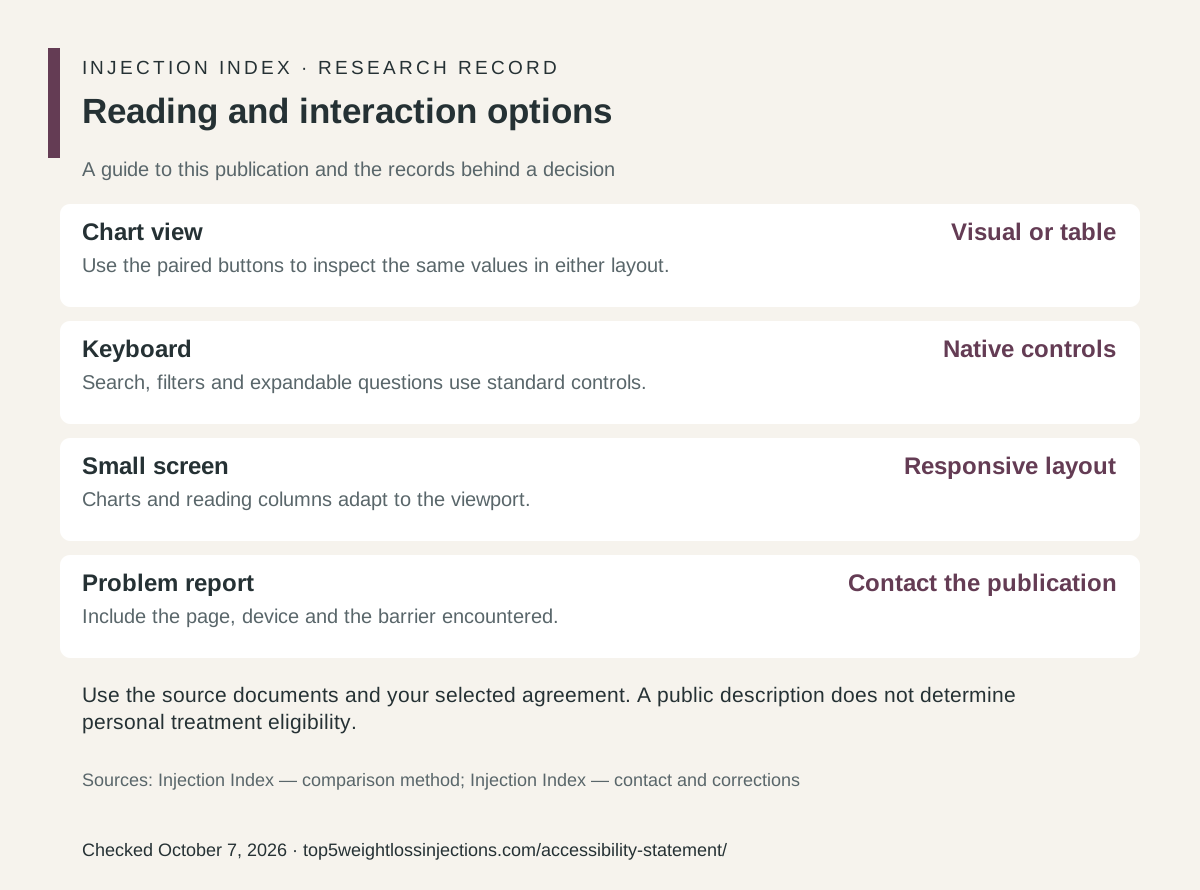
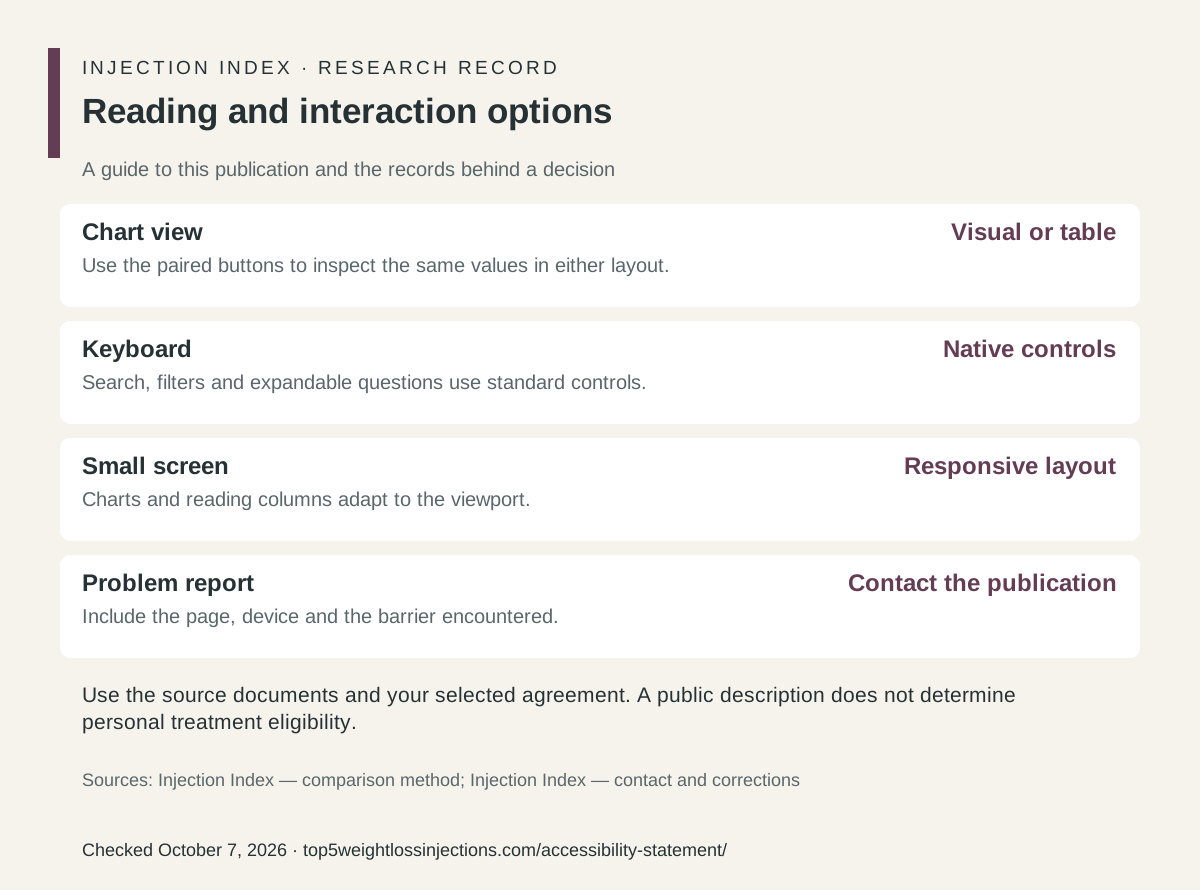
Reading and interaction options
A guide to this publication and the records behind a decision
- Chart viewVisual or table
Use the paired buttons to inspect the same values in either layout.
- KeyboardNative controls
Search, filters and expandable questions use standard controls.
- Small screenResponsive layout
Charts and reading columns adapt to the viewport.
- Problem reportContact the publication
Include the page, device and the barrier encountered.
Use the source documents and your selected agreement. A public description does not determine personal treatment eligibility.
View the printable chart image
Alternatives are part of the content
Every research chart has its data in text and provides a table view. Source notes remain visible in either mode. Downloaded SVG charts include a title and description, but the webpage’s text representation is the primary alternative for readers who do not use the graphic.
The site provides visible focus, a skip link and headings for navigation. These implementation choices are not a formal accessibility certification. Report a specific barrier through the contact page so the affected route and control can be investigated.
Questions worth answering
Where can I report a problem with this page?
Use the contact page and include the affected URL and a public source or a description of the website problem. Do not send sensitive medical or payment records to the editorial inbox.
Sources & chart notes
Checked October 7, 2026. Provider pages establish advertised terms. Labels and trial reports describe specific medicines and study populations. Medical review has not been completed.
- Injection Index — comparison method ↗Publication method
- Injection Index — contact and corrections ↗Publication process
Updated October 7, 2026.